1. Validate a calibration
Run the validator on one candidate and read what it says.
The frame
disp2vlm-validate demo demo
demo/ now holds a small synthetic frame (disp2vlm_validation.demo):
| Path | What |
|---|---|
disp/ |
20 DISP-S1 pairs in two reference blocks (21 dates, 12 days apart), 40 × 60 pixels of 2 km |
perfect/, half/, none/ |
three DISP-CAL candidates, laid out as cal-disp writes them: products/<ref>_<sec>/OPERA_L4_DISP-CAL-*.nc |
water_mask.tif, los.tif |
the land mask and the line-of-sight unit vector (east, north, up) on the DISP grid |
cache/ |
the frame's frozen GNSS: MIDAS rates and daily positions of 16 stations |
configs/ |
one run.yaml per candidate, and gate.yaml |
Truth is a 10 mm/yr east-west velocity gradient, seen with a vertical look.
Every DISP pair adds a random ramp across the frame, the long-wavelength
error a calibration exists to remove. The perfect candidate removes exactly
that ramp.
The run
disp2vlm-validate run --config demo/configs/perfect.yaml
F99999 perfect: PASS
What happened, in order (disp2vlm_validation.pipeline.run_validation):
- Stack. Every DISP pair is matched with the candidate's DISP-CAL product
by its reference and secondary dates. The calibrated displacement is
DISP − calibration. Pairs are chained across reference blocks into one series per pixel. - Velocities. A streaming fit gives the raw and calibrated LOS velocity
per pixel. The raw one does not depend on the candidate, so it is cached
per stack in
cache/. - GNSS. Station MIDAS rates and daily positions are projected to the line of sight. Each station is matched to its pixel; a 7 × 7 window median is used next to the pixel value.
- Metrics. Velocity against MIDAS per station class, and the double-difference sill of InSAR minus GNSS for raw and calibrated.
- Gate. The rules in Metrics and gate decide the verdict.
- Outputs.
demo/runs/perfect/(below).
Reading the numbers
demo/runs/perfect/metrics.json holds everything the report shows. The two
numbers that matter most here:
| raw DISP | calibrated | |
|---|---|---|
| DD sill (mm²) | 8.12 | 0.92 |
| velocity vs MIDAS, 16 stations: median / RMSE (mm/yr) | – | +0.29 / 0.95 |
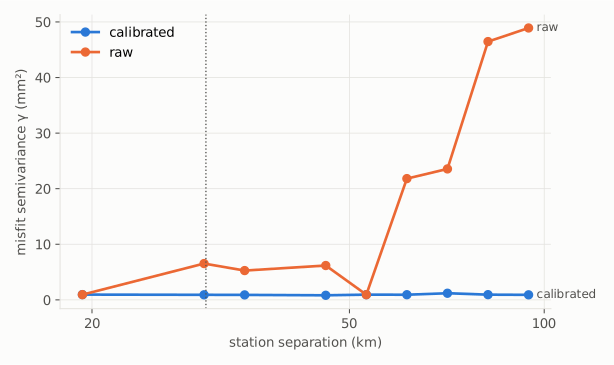
The double-difference sill is the one metric that compares raw and calibrated on equal terms. For every pair of stations, the InSAR-minus-GNSS misfit of their relative displacement series is reduced to a variance. Differencing between stations cancels the datum, so the raw product's arbitrary reference does not matter. The sill is the median over station pairs far apart (here ≥ 30 km; ≥ 50 km on real frames): the long-wavelength error. Calibration exists to remove it, so the sill must drop. Here it falls by 89%.
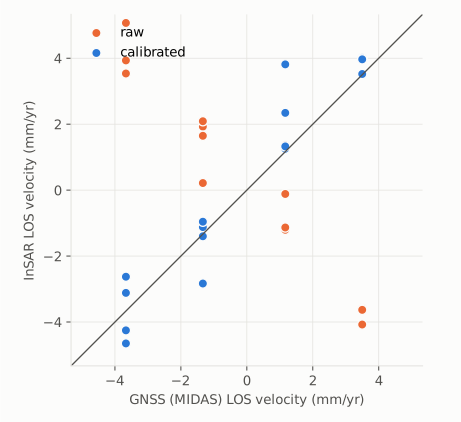
Velocity against MIDAS checks absolute rates: the calibrated LOS velocity at each station against the station's MIDAS rate in the same line of sight.
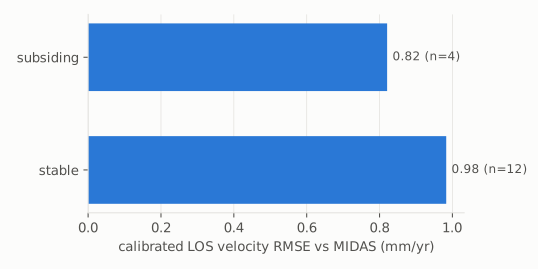
Station classes. Stations are sorted into classes because a single
number hides where a calibration fails. The demo has two: subsiding (GNSS
vertical rate below the threshold, 4 stations) and stable (12).
The outputs
| File | What |
|---|---|
report.html |
verdict, sills with bootstrap intervals, velocity by class, figures, requirements traceability |
metrics.json |
every number in the report, plus the config hash |
stations.csv |
per station: position, MIDAS rates, LOS vector, InSAR at the pixel (pix::) and window median (med::), raw and calibrated, class |
station_series_mm.csv |
calibrated LOS series at each station |
calibrated_velocity_mm_yr.tif |
calibrated LOS velocity, GeoTIFF on the DISP grid |
sill_draws.npz |
bootstrap draws of each sill |
figures/*.svg |
the three figures above |
Caching
Run the same command again and it returns at once. A run is cached by a hash
of the package version, the config and its input files; --no-cache
recomputes.